
How to read a Map
We are using maps as a medium to represent various data sets spatially. It helps us to quickly visualize the scenario before reading a thousand words report.
But if your phone is down and you have to go from village A to village B using the operational map in your pocket, will you be able to do so?
There are several key elements that is mostly included each time a map is created in order to aid the viewer in understanding the communications of that map. Descriptions of some of such cartographic elements are given below:
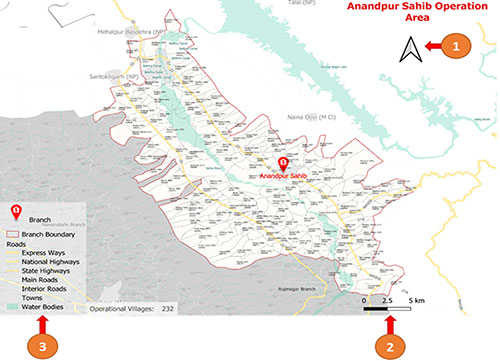
1) NORTH ARROW: The purpose of the North arrow is to show the orientation of the map. This allows the user to determine the direction of the map as it relates to due north.
2) SCALE: The scale explains the relationship of the data frame extent to the real world distances. The description is a ratio. This can be shown either as a unit to unit or as one measurement to another measurement.
There are 3 types of Scales:
a) Verbal Scale: In this type, the scale is explained in a sentence. Example: ‘1 centimetre on the map represents 500m on the ground’
b) Fraction Scale/ Ratio Scale:
This map shows the scale in a ratio. For example: ‘1:50000’ : Here such a scale means that one unit of measurement is equal to 50,000 of the same unit in the map.
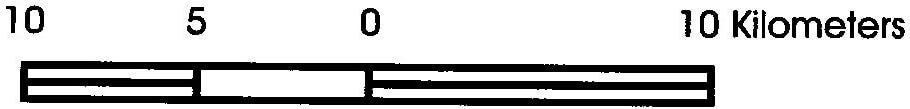
c) Graphical Scale/ Bar Scale:
Graphical scale visually shows the relationship between the distances on the map and the distances on the ground. This type of scale gets adjusted with the sheet size as it stretches/ shrinks with increase/ decrease on print size. Hence, this type of scale is majorly used while making maps.
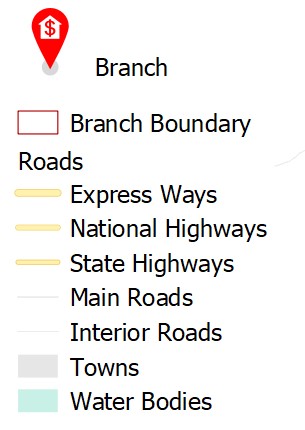
3. LEGEND: The legend serves as the decoder of the map. Descriptions detailing any colour schemata, symbology or categorization is mentioned here. Without legend, the colour scheme or symbologies would not make any sense to the viewer. The more complicated the symbology on a map the more important the legend becomes. The legend of this map gives details about colour schemes of the villages and towns, road categories, boundary of the branch, location of the branch and water bodies
Regardless of the map content, most maps have the above common elements for better understanding of the map.
Posted in Uncategorized